


How Can Test Scores Be Going Both Up AND Down?

Are California Students' Test Scores Going Up or Down?
Each spring, California public school children in grades 3-8 and 11 take a set of tests known as the CAASPP (the California Assessment of Student Performance and Progress). In summer, families receive the results electronically. In autumn, schools and districts receive data that aggregates students' scores. By the end of the year, the scores are used as part of the California School Dashboard.
The tests are based on the Common Core standards, which describe what students should know and be able to do in each grade level. Each year, each student's individual CAASPP report evaluates their score based on those expectations. (See Ed100 Lesson 9.3 for samples of these reports.)
Students and parents see the score (a four-digit number) along with where the score falls within four bands: Standard Exceeded, Met, Nearly Met, or Not Met. It's really common for scores to be close to the "cut point" between the bands. There's some wiggle room in these scores.
As students advance from one grade to the next, the report also shows their individual progress, delivering useful evidence of whether they are keeping up with expectations, moving ahead or falling behind.
The reports make good sense at an individual level. When combined and compared, however, individual scores become statistics.
And that's where the mischief is made, isn't it?
How Is Improvement Measured?
In September, the California Department of Education released summary data about 2019 scores on the CAASPP tests, now in their fifth year (2019). On their own, the scores are abstract; each test yields an unmemorable four-digit number.
Cut Points
To give the scores some meaning, the State Board of Education has defined cut points with labels. These cut points vary from one test to the next, but remain stable from year to year. For example, in fifth grade English Language Arts, the minimum score for "Standard Met" is 2502. A score of 2501 is evaluated as "Standard Nearly Met." (See California's Common Core Dashboard on Ed100 for a walk in the weeds.)
In order to communicate with the public about student performance on the tests, the state lumps the results using the cut points. For example, in 2018, slightly less than half of students scored above the cut point for meeting the state standard in English Language Arts. In 2019, slightly more than half did so. Average math scores were even lower. EdSource assembled the test score data to summarize multiple years of data:
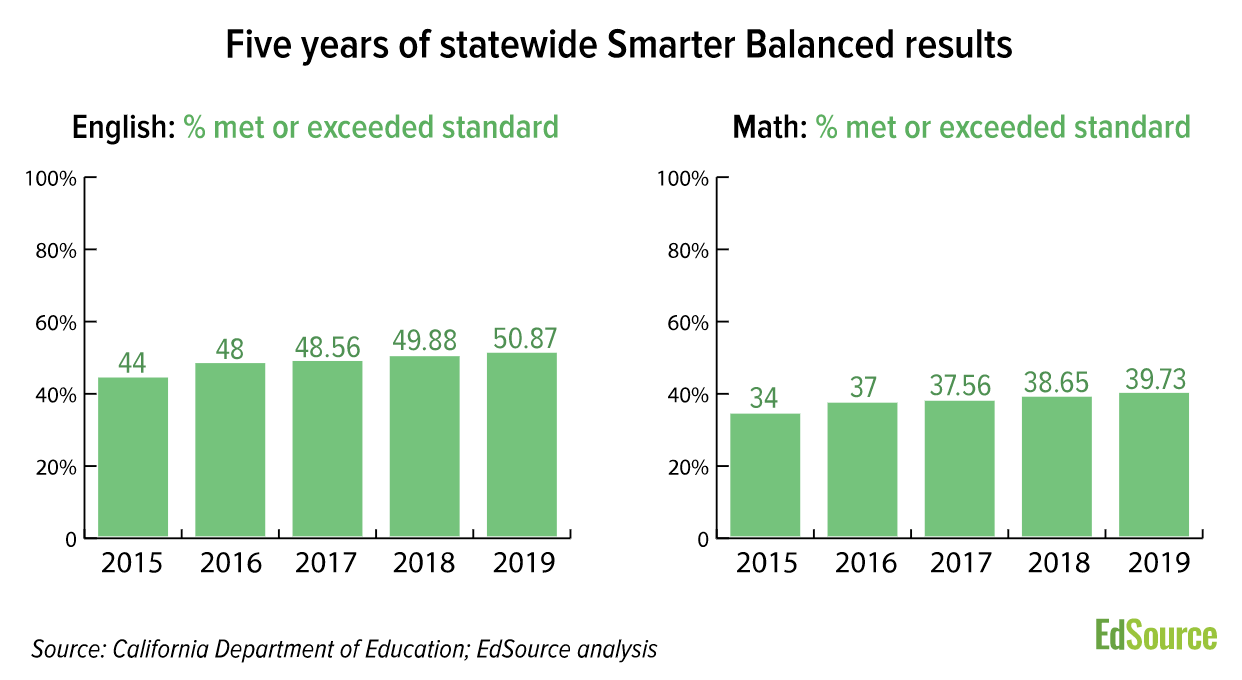
As usual, averages conceal details. These five years of results are like five separate snapshots captured through a wide-angle lens. EdSource did what it could to help districts and schools zoom in to the data for different groups so they can spot trends that might help them focus. There is some evidence that the test scores of English Learners may have improved a bit, on average.
"Cohort" Average Analysis
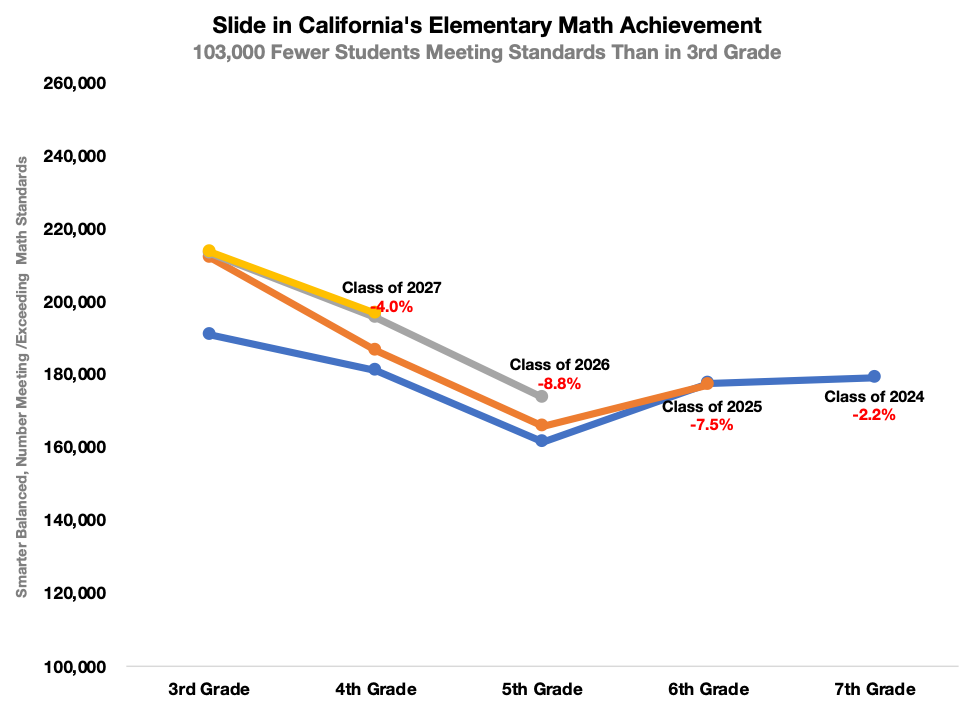
By making the data public, the state of California enabled people to analyze it in other ways. For example, David Wakelyan of Union Square Learning suggests looking at the data by graduation year ("cohort analysis") to pinpoint the grade level and subject in which groups of students, on average, are falling behind. In a commentary for EdSource, he documents a significant "slide" in the proportion of students meeting math standards as they transition from third grade to fifth grade.
Parsec Education, a consulting firm, produced a similar visual analysis of the five-year cohort data for the state and for each county, including a bit more detail about which parts of the tests students seem to struggle on.
The cohort approach adds some clarity, and California uses a version of it in the California School Dashboard. But it is still based on averages: if one student in a cohort does brilliantly and another does miserably, their results can cancel out.
Isn't It Individual Growth That Really Matters?
But wait, you might say. If this kind of averaging obscures the difference between good results and bad results, why use it? Wouldn't it be better to summarize the statistics about individual improvement year-to-year, comparing students to themselves in their journey to master the standards?
The exceptions are Kansas and California
That kind of analysis (known as student-level growth analysis) is already possible in 48 out of the 50 states. The exceptions (as of 2019) are Kansas and California. Writing for PACE, Morgan Polikoff of the USC Rossier School of Education argues that California should get on board and adopt this kind of model.
OK, but don't expect a growth model to produce sudden clarity, cautions Doug McCrae in a comment for EdSource. High-poverty families tend to move a lot, making the data hard to compare. "Some data sets will have large percentages of mobile students who have scores for only one of the two grade levels," he points out, "and thus will be eliminated from the longitudinal analyses. Such efforts provide a biased view of gains or losses based on cherry-picked “stable” students only."
Does It Really Matter How You Measure?
The discussion about how to summarize test results matters, in part, because federal law requires states to intervene in their lowest-performing schools. Under the old federal No Child Left Behind law (NCLB), the worst-performing schools faced sanctions — they could be shut down. Staff could be fired.
Under NCLB's replacement, the Every Student Succeeds Act (ESSA), the lowest-performing schools are still called out, but the consequences are more bittersweet. Instead of penalties these schools now receive some extra help from a state-funded program known as the California Collaborative for Educational Excellence (CCEE).
Identifying the schools that receive this support requires more judgment than you might think, as explained in a presentation by Heather Hough of Policy Analysis for California Education (PACE). Some of the schools to include on a list for intervention are obvious, but many aren't. In 2018, California's Department of Education quietly devised a way to choose its list of schools using the California School Dashboard.
What Parents Need to Know
Parents should look at their kids' individual CAASPP score reports and take them seriously.
CAASPP scores are not "high stakes" for your child
Yeah, it's just one test on one day, and it doesn't "count" in the sense that it won't show up on a report card. CAASPP scores are not "high stakes" for your child. But it might be the most honest feedback you're going to get. If your student is getting high grades in school but low scores on the CAASPP report, ask questions. Something is going on.
So, back to the question we started with. Are students' test scores in California going up or down? There are at least two meaningful answers. In one sense, the answer is UP. Average scores in both English language arts and math are improving across the system from year to year, albeit very slightly.
But in another sense that should matter to parents, the answer is also DOWN. Particularly in elementary grade math, as students advance from one year to the next they are falling behind grade level expectations. They aren't catching up. California's children are more likely to meet grade level expectations in third grade than at any later time in their education.
|
Questions for parents to ask about test scores: |
|---|
|
If the scores at your school are not improving, ask the principal and site council to explain its strategy. If scores are improving, consider asking school staff to highlight what they are doing to make this happen. |
|
If there is a district-wide trend, ask what strategies are in the district's plan (the LCAP) to take action. |
|
Hold a parent information night with speakers from your school or district. Ask them to express their insights about the test scores, and what teachers need from parents for kids to be more successful. |
Tags on this post
Test scoresAll Tags
A-G requirements Absences Accountability Accreditation Achievement gap Administrators After school Algebra API Arts Assessment At-risk students Attendance Beacon links Bilingual education Bonds Brain Brown Act Budgets Bullying Burbank Business Career Carol Dweck Categorical funds Certification CHAMP Change Character Education Chart Charter schools Civics Class size CMOs Collective bargaining College Common core Community schools Contest Continuous Improvement Cost of education Counselors Creativity Crossword CSBA CTA Dashboard Data Dialogue District boundaries Districts Diversity Drawing DREAM Act Dyslexia EACH Early childhood Economic growth EdPrezi EdSource EdTech Effort Election English learners Equity ESSA Ethnic studies Ethnic studies Evaluation rubric Expanded Learning Facilities Fake News Federal Federal policy Funding Gifted Graduation rates Grit Health Help Wanted History Home schools Homeless students Homework Hours of opportunity Humanities Independence Day Indignation Infrastructure Initiatives International Jargon Khan Academy Kindergarten LCAP LCFF Leaderboard Leadership Learning Litigation Lobbyists Local control Local funding Local governance Lottery Magnet schools Map Math Media Mental Health Mindfulness Mindset Myth Myths NAEP National comparisons NCLB Nutrition Pandemic Parcel taxes Parent Engagement Parent Leader Guide Parents peanut butter Pedagogy Pensions personalized Philanthropy PISA Planning Policy Politics population Poverty Preschool Prezi Private schools Prize Project-based learning Prop 13 Prop 98 Property taxes PTA Purpose of education puzzle Quality Race Rating Schools Reading Recruiting teachers Reform Research Retaining teachers Rigor School board School choice School Climate School Closures Science Serrano vs Priest Sex Ed Site Map Sleep Social-emotional learning Song Special ed Spending SPSA Standards Strike STRS Student motivation Student voice Success Suicide Summer Superintendent Suspensions Talent Teacher pay Teacher shortage Teachers Technology Technology in education Template Test scores Tests Time in school Time on task Trump Undocumented Unions Universal education Vaccination Values Vaping Video Volunteering Volunteers Vote Vouchers Winners Year in ReviewSharing is caring!
Password Reset
Search all lesson and blog content here.
Login with Email
We will send your Login Link to your email
address. Click on the link and you will be
logged into Ed100. No more passwords to
remember!


Questions & Comments
To comment or reply, please sign in .