


You Earned a Ticket!
Which school do you want to support?

Does California skimp on public education? Put another way, is it true that students in California receive less support for their education than students do in other places?
In This Lesson
Does California under-fund education?
Why does public education cost so much in California?
Why does it matter that California under-invests in education?
Why does California under-spend on education?
How does California’s tax burden compare to other states?
Why doesn’t California spend more money on education?
Does California have a disproportionate number of students?
Has California's education spending kept up with inflation?
Does California spend more on prisons than on schools?
★ Discussion Guide
The short answer is yes. As this lesson will explain, California has a long record as a skimpy funder of education, but context matters. California’s education budget is strongly influenced by the stock market. In the post-pandemic boom, wealthy taxpayers became wealthier, tax receipts increased, and education funding increased with it.
(1) California spending per student on education is basically normal.
In 2022, most analysts reckon that California’s education funding, compared to other states, at long last climbed to the level of essentially… ordinary. Not at the top. Somewhere in the middle, if you look at it one way. Or lower than ever, if you look at it another way.
How can funding be both ordinary and skimpy? Well, buckle up. Measuring and comparing is more complicated than it might seem.
The most basic way to compare states’ support for education is to look at the number of dollars spent on K-12 education each year and divide by the number of students enrolled:
The chart above makes it look as if education spending has increased at an ever-accelerating rate. Which it has… but not really. Over time, even low rates of inflation add up. Dollars are only good for what they can buy.
A somewhat fairer way of looking at education funding is to restate the value of expenditures in past years taking inflation into account. There’s more than one way to do it. The most basic, widely-used, general-purpose deflator is the venerable Consumer Price Index (CPI-U), which helps remove some of the distortion:
The upward bias in the chart above reveals a problem of measurement. The CPI describes change in the average cost of stuff-in-general, but the cost drivers for education have risen at much higher rates than the CPI. For example, the cost of earning a college degree (which teachers need) has risen faster than core inflation. So has the cost of health insurance, which school districts provide to teachers as part of their benefits.
In response to this problem, the St. Louis Federal Reserve developed a national alternative to the CPI, which California and other governments have adopted in law. (With all the poetic flair a government statistician could apparently muster, it’s known as the implicit price deflator for state and local government expenses).
What about regional cost differences?
Adjusting for nationwide average inflation helps make resource comparisons more meaningful over time, but it doesn’t address differences in regional costs. It costs more to hire a teacher in New York than in Utah, but it costs a lot more to live in New York than it does in Utah.
To compare the effective purchasing power of education systems, some analysts have attempted to adjust for local and regional differences in purchasing power. EdWeek uses this approach in its widely-quoted, annual Quality Counts scorecard. (Subscription required.) For each state, the EdWeek scorecard restates state-by-state dollars in order make them hypothetically comparable in terms of purchasing power. The numbers are often misunderstood or quoted out of context.
2) Economic effort: California doesn’t try very hard to fund education
A broader way to consider social priorities is to put dollars in context. For example, in 1960, overall spending on health care accounted for about 5% of the US Gross National Product (GDP). As medical progress improved and life expectancy improved with it, health care’s share expanded to about 20% of the economy. Military spending in the same period dropped from about 9% of the US economy to about 4%. Infrastructure spending in the US is about 1.5%.
When comparing the economies of US states, the measure most equivalent to GDP is total personal income.
Economists refer to the relative level of spending on a social priority as economic effort. In 1970, the average US state spent 4.0% of its economy on public K-12 education, a level of economic effort fairly comparable with other developed nations. This level of effort wilted over time — by 2021 the average state’s economic effort to fund education had declined to about 3.44%.
As usual, averages can conceal big differences. Some states (like New York) have invested sustained effort to fund public education. Relative to other states, California has consistently spent less of its total economy on public K-12 education. California has been a low-effort state when it comes to education:
In 2021, California’s economic effort to fund public education dropped to 0.03, its lowest level since 1984. The stock market delivered good news for education funding without really trying.
(3) It costs more to educate students in California than it does in other states
Money is only good for what it can buy. Costs vary from place to place, and California is a high-cost state.
Most of the costs of education are people costs. It’s expensive to hire college-educated adults such as teachers, counselors, librarians, and administrators. Relative to other states, the cost of living in California is high, and districts must offer competitive salaries in the context of their local labor market. On an inflation-adjusted basis, teacher pay in America has essentially been flat for 50 years. (Ed100 Lesson 3.8 examines teacher pay in depth.)
(4) California has an average number of kids to educate
When it comes to demographics, California is often compared with Florida and Texas. All three states are large and have had rapid population growth, with a high proportion of students learning English. California has America's highest proportion of English Learners.
The age demographics of these states differ significantly, however, which can make comparisons among them a little confusing. Like Hawaii, Massachusetts, and Washington, D.C., Florida enjoys the benefit of an older tax base — it has relatively few children supported by relatively more taxpayers. Texas, by contrast, is more like Utah, a youthful state where funds for education must be spread among more students. California falls in between.
(5) California has very large class sizes and fewer support services
The math is inescapable. A state with average funding per student, an average number of students per taxpayer and higher-than-average pay for teachers must make do with fewer teachers.
Students experience this difference in the form of large class sizes, a topic we take up in detail in Lesson 4.2. Because teachers are crucial to student success, and because they are represented at the negotiating table, when times are tight school districts tend to avoid cutting teacher positions, instead sacrificing everything else they can first, including counselors and administrators. Wherever class sizes are chronically large, as they are in California, students have less of everything.
(6) California has somewhat high taxes overall
Public education relies on a combination of state and local taxes in each state. The mix differs a bit from one state to the next, and as Ed100 Lesson 8.3 will explain, California dramatically shifted away from property taxes after passage of Proposition 13 in 1978. Higher income taxes, particularly on high earners, partially filled the gap. According to research by the Tax Foundation, the total “tax burden” in California is a few percentage points higher than in most other states. WalletHub replicated this finding in 2020 using similar methodology.
California's highest-income earners are taxed at a higher rate than taxpayers in most other states. In total, though, the state's tax system is regressive, meaning that taxpayers with lower incomes carry a higher tax burden than wealthier taxpayers. Want to know even more? California's Legislative Analyst produced a report with a full rundown of California's Tax System in 2018.
A budget is an expression of values
Does California’s long pattern of low effort to fund public education mean that Californians place a relatively low value on it? It might. For example, since 1970 California has significantly increased spending on prisons and incarceration. To be clear, schools are a much bigger piece of the budget pie than prisons, but spending on prisons grew far faster than spending on schools.
Structurally skimpy
Long-time observers of California's education system often attribute the state's habit of weak effort to fund public education to Proposition 13, which flipped the education finance system from stable local funding (through property taxes) to volatile state-sourced funding (through income taxes).
An unintended consequence of Prop. 13 is that it weakened voters' political will to fund schools adequately. In general, voters are most likely to support taxes that help their immediate community. They are apt to doubt that taxes levied on a statewide basis will be spent well. By flipping the basic revenue model from local to statewide, California overturned its political underpinnings. The effort to fund public education in the state has never recovered.
Does funding for education matter?
Why is it important to know whether California skimps on education? Because it turns out that money really does matter. It seems obvious, but for a very long time education outcome data were so low-quality that it was quite difficult to prove a connection between money and learning. The connection was significantly clarified in a pair of 2018 studies titled Money and Freedom, which found that "money targeted to districts with the greatest student need has led to improvements in student outcomes."
Other research has corroborated the connection. For example, How Money Matters, a study by the Learning Policy Institute, concludes that "on average, aggregate per-pupil spending is positively associated with improved student outcomes."
If serious money were added, where would it go, and what might result? These questions are taken up in Ed100 chapter 10.
Clueless
Education is the largest function of government.
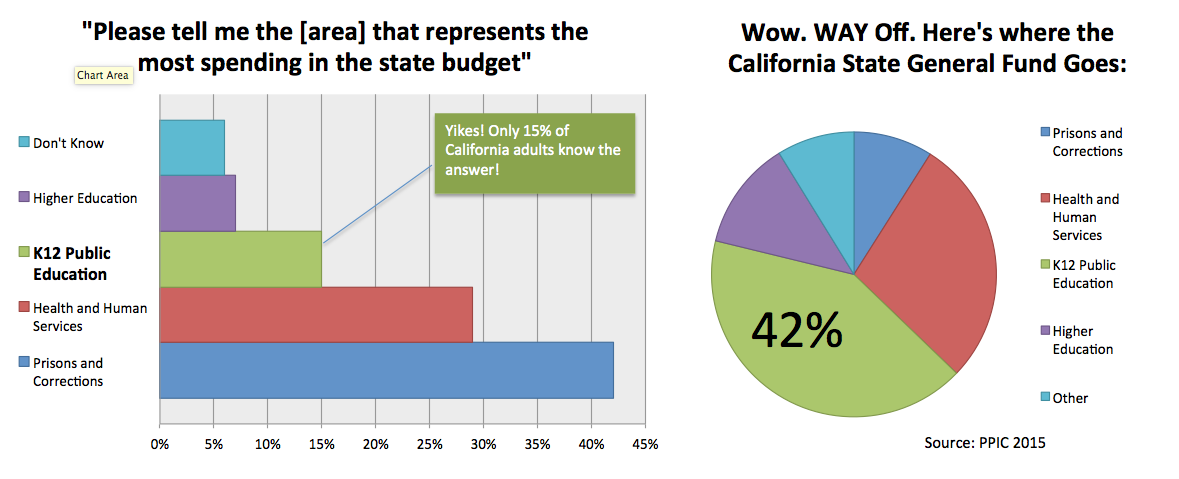
It's important to acknowledge that most Californians have no idea at all about their state's level of investment in education, either in absolute terms or relative terms. In a 2015 survey by the Public Policy Institute of California (PPIC), only 15% of Californians could correctly identify the biggest slice of the state's budget. Nearly half thought that the state spends more on prisons than any other function. Not even close.
 Source: PPIC
California could do a lot more to fund public for K-12 education, but it is still the largest function of state and local government.
Updated August 2017
April 2018
October 2018
January 2021
September 2022
CHAPTER 8:
…with Resources…
-
…with Resources…
Overview of Chapter 8 -
Spending
Does California Spend Enough on Education? -
Education Spending
What can education dollars buy? -
Who Pays for Schools?
Where California's Public School Funds Come From -
Prop 13 and Prop 98
Initiatives that shaped California's education system -
LCFF
The formula that controls most school funding -
Categorical funds
Special education and other exceptions -
School Funding
How Money Reaches the Classroom -
Effectiveness
Is Education Money Well Spent? -
More Money for Education
What Are the Options? -
Parcel Taxes
Only in California... -
Volunteers
Hidden Treasure Trove for Schools
Related
-
History of Education
How have Schools Changed Over Time? -
Purpose
What is Education For, Really? -
Teacher Pay
How much are teachers paid? -
Principals and Superintendents
The Pivotal Role of an Educational Leader -
Teachers' Unions
Don't Underestimate Them -
When Schools Fail
Interventions and Consequences -
Education Spending
What can education dollars buy? -
Prop 13 and Prop 98
Initiatives that shaped California's education system -
Effectiveness
Is Education Money Well Spent? -
Go Big
What Money Might Do -
Change
What Causes Change in Education?
Sharing is caring!
Password Reset
Search all lesson and blog content here.
Login with Email
We will send your Login Link to your email
address. Click on the link and you will be
logged into Ed100. No more passwords to
remember!


Questions & Comments
To comment or reply, please sign in .
Carol Kocivar April 26, 2023 at 5:50 pm
from the Albert Shanker Institute
Our proposal, put simply, is for federal aid to be allocated based not only on student need (as is currently the case), but also on how much states and districts are able and willing to contribute—in other words, based on their effort. With full funding and compliance, this proposal would provide every school district with the estimated revenues necessary to reach the goal of average national outcomes in mathematics and reading.
The price tag? $52 billion per year—or roughly double what the federal government currently provides to K-12 schools, which are funded overwhelmingly by state and local revenue.
https://www.aft.org/ae/spring2023/baker_dicarlo_weber
Carol Kocivar January 9, 2023 at 4:38 pm
Funding level: D
Funding Distribution: B
Funding Effort: F
https://edlawcenter.org/assets/files/pdfs/publications/Making-the-Grade-2022-Report.pdf
Carol Kocivar July 23, 2022 at 6:01 pm
Education Budget 2022-23
The Budget includes total funding of $128.6 billion for K-12 education, reflecting $22,893 per pupil ($16,993 K-12 Proposition 98 General Fund). In addition to this funding, the Budget includes $5.1 billion General Fund for K-12 school facilities, including new preschool and transitional kindergarten facilities.
Carol Kocivar June 14, 2022 at 6:29 pm
https://www.ppic.org/publication/financing-californias-public-schools/
Carol Kocivar June 5, 2022 at 4:41 pm
For the first time since the turn of the millennium, California’s K–12 public system enrolls fewer than 6 million students. Recently released statewide numbers show that enrollment fell by 110,000 students, or 1.8%, between 2020–21 and 2021–22. Enrollment has now declined for five straight years, with a decline of 270,761 students over the past two years, compared to 65,234 from 2016–17 to 2019–20. Moreover, recent declines have outstripped state projections
https://www.ppic.org/blog/california-k-12-enrollment-declines-continue-to-exceed-expectations/?utm_source=rss&utm_medium=rss&utm_campaign=california-k-12-enrollment-declines-continue-to-exceed-expectations?utm_source=ppic&utm_medium=email&utm_campaign=blog_subscriber
Carol Kocivar June 5, 2022 at 3:19 pm
Fueled by growing state revenues and billions in one-time federal aid, California public schools have seen record-high funding in recent years. The state has caught up and surpassed the national average in school spending, after lagging behind the nation for decades. “
View their video: Understanding the effects of school funding.
https://www.ppic.org/blog/video-understanding-the-effects-of-school-funding/
sarah Ruiz January 20, 2022 at 3:17 am
Carol Kocivar January 20, 2022 at 5:56 pm
Nicole Blaylock March 5, 2022 at 11:03 am
Carol Kocivar March 11, 2022 at 3:30 pm
Jamie Kiffel-Alcheh November 28, 2019 at 8:33 pm
Does this mean that in spite of these increases on this wealthiest earners, the lowest earners are still paying more?
I would also argue that the story buries its lead. The lead seems to be: California’s state budget gives more to education then to any other service, yet it still lags behind other states.
amosmickey March 5, 2019 at 9:55 am
francisco molina February 17, 2019 at 7:15 pm
Carol Kocivar June 18, 2018 at 6:25 am
Here is the link.
Carol Kocivar January 14, 2018 at 9:48 am
How Money Matters
"Recent studies have invariably found a positive, statistically significant relationship between student achievement gains and financial inputs."
Read the Report:
How Money Matters
November 22, 2017 at 10:58 am
You can reasonably argue DC or MA are special cases but in a sense every state is a special case. CA gets a lot of less educated immigrants and that might tend to skew outcomes as it takes a while to raise the educational standard of a community.
C.f., "lurking variable"
http://www.virmanimath.com/start-page-2012-2013/ap-stats-2012-2013/chapter-2/apstatonlineclass/confounding-and-lurking-variables
November 22, 2017 at 10:55 am
https://www.nationsreportcard.gov/profiles/stateprofile?chort=2&sub=MAT&sj=AL&sfj=NP&st=MN&year=2015R3
Money does not correlate with outcomes in at least that assessment.
Massachusetts is usually at the top of the list and they are famous for the rigor of their statewide tests. Maybe that has more to do with it?
November 22, 2017 at 10:50 am
The courts ruled (rightly, IMHO) that it was unfair that rich areas spent more on education than poor areas because education was funded by property taxes. Poor kids need at least as much money per pupil. This means it has to be state money. The voters also passed prop 98 to guarantee the legislature spends at least 40% on education. That was to set the minimum and in fact that turns out to be the maximum they will spend. So talk to the legislature.
Caryn-C September 11, 2017 at 11:09 am
I wonder if the California education system is weakened by educating millions of children of unauthorized immigrants or if that is just a myth. I know that some undocumented immigrants do pay taxes. Is the additional tax base that would support these students just not there?
Imo, comparing California to other states is often unhelpful because frankly, there IS no other state like California, population and demographic-wise.
Carol Kocivar December 29, 2016 at 4:05 pm
http://www.nytimes.com/2016/12/12/nyregion/it-turns-out-spending-more-probably-does-improve-education.html?rref=collection%2Ftimestopic%2FNational%20Bureau%20of%20Economic%20Research&action=click&contentCollection=timestopics®ion=stream&module=stream_unit&version=latest&contentPlacement=1&pgtype=collection
Carol Kocivar October 27, 2016 at 3:30 pm
"California spent an estimated $2,000 more per K-12 student in 2015-16 than in 2012-13, inflation-adjusted. Largely as a result, the gap in spending per student between California and the rest of the US narrowed from more than $2,600 in 2012-13 to roughly $1,000 in 2015-16.
http://calbudgetcenter.org/resources/californias-spending-per-student-increased-due-proposition-30-still-trails-rest-us/
germanb May 25, 2016 at 1:30 pm
http://www.cde.ca.gov/fg/fr/sa/cefavgsalaries.asp
The system seems to be more in place to employ teachers than educate kids. I hope the millennials start taking notice and force the change that is needed to save the public educational system. It's going to take more than just MORE MONEY.
Lynette Garcia March 4, 2017 at 2:44 pm
Jeff Camp - Founder March 8, 2016 at 12:18 pm
My criticism of the analysis: it would be even more meaningful to compare California to the rest of the US *excluding California. This state is so large that it influences the average, making California seem more normal than it actually is.
Jeff Camp - Founder February 12, 2016 at 2:02 pm
Carol Kocivar November 23, 2015 at 3:00 pm
A big item in the comparisons is whether they adjust for differences in state costs of living.
Hint: California has a high cost of living.
A report from the California Budget and Policy Center, "Key Considerations When Comparing California K-12 School Spending to Other States" provides a good overview.
http://calbudgetcenter.org/resources/key-considerations-when-comparing-california-k-12-school-spending-to-other-states/
Brandi Galasso September 30, 2015 at 7:37 pm
Meghan B August 18, 2014 at 9:49 pm
Also, I think it would be clearer to say, "3.3% of total income" rather than "3.3% of its economy," if that's what you mean. The phrase "its economy" isn't exactly clear to me.
Jeff Camp - Founder August 29, 2014 at 10:01 pm
Jennifer B June 12, 2014 at 1:31 pm
However, this reality creates a significant moral hazard for California public education. Taxes that are portrayed as "funding education" often go elsewhere -- or back fill diversions of base taxes that we all thought were funding education.
The majority of counties, for example, do not accurately represent where our property tax dollars actually go. Unless your county shows 10-30% of total property tax dollars diverted to "in-lieu taxes to cities and counties for VLF reduction and Economic Recovery Bonds," it is significantly overstating property taxes to education.
The state, meanwhile, shows the $6+ billion of General Fund monies it spends to backfill these transfers as General Fund expenditures on K-14 education. (When it is able to backfill these transfers. It has not done so fully in seven of the ten years since they were instituted.)
And the premise of Proposition 30 (2012) was not to increase education funding, but simply to forestall cuts.
California voters are told that the lion's share of property and income taxes go to education ... yet little seems to trickle through.
Paul Muench October 31, 2014 at 9:22 pm