


You Earned a Ticket!
Which school do you want to support?

Imagine if Amazon.com were unable to keep track of customer purchases. Imagine a pharmaceutical company unable to tell one pill from another. Or a bank losing track of accounts. In the last few decades, the world has become accustomed to the idea that big organizations should be good at data.
In This Lesson
How does California’s education data system compare?
How much does California spend on school data systems?
Why is California's school data system weak?
What data does California collect about students?
Why is education data so delayed?
How can I see data about my school?
What is a School Accountability Report Card (SARC)?
What data is included in the LCAP?
What is a School Plan for Student Achievement (SPSA)?
Is my information private in school data systems?
★ Discussion Guide
Education has a long way to go in that regard, especially in California.
America's public data tangle
Accounting is detailed work. Business organizations pay top dollar for employees with the skills needed to maintain orderly financial records and processes across far-flung locations. Errors can be terribly expensive, so businesses tend to centralize their financial accounting systems and audit them regularly. Most public companies assemble figures from all over the world every month or more, summarize results quarterly, and issue a full report annually.
Local and state government systems face many of the same challenges as businesses, but they tend to be far less consolidated. In California alone, there are over 1,000 school districts, each with a significant amount of sovereignty over how it operates. Under the supervision of county offices of education, school districts have some practical reasons to want to follow accepted accounting practices so that they receive funds in a timely way, but there's a looseness to it all. Giant school districts have accounting needs that warrant complex systems. Tiny, rural districts can't afford them.
To understand the overall condition of local and state education in America, the US Department of Education suggests accounting practices, but it lacks the mandate to enforce them or command data delivery on a timeline. Even seemingly-simple questions like "how many teachers are employed by your district" can be hard to answer. Districts don't have a big incentive to spend time and energy conforming to national data standards, and many don't.
Comparable data about education takes three years to arrive
Every year, state and local leaders would like to be able to say how their schools currently compare to schools in other states. They can't. It takes about three years for the National Center for Education Statistics (NCES) to assemble data from federal, state and local sources. Then they have to massage it, correct it and release it, usually with a robust appendix of cautionary footnotes. When the "latest numbers" are released, they are almost always absurdly out of step with current conditions. Try searching Google for information about how your state ranks in education expenditures per student. You won't get a straight answer.
California’s state data tangle
California is revamping its education data systems.
When it comes to education data, California is at last taking steps to improve its infrastructure. Compared to other states, California is changing the game by investing in new data systems.
In the 2010's, the national Data Quality Campaign (DQC) regularly evaluated state-level education data systems. In 2012, it awarded California a low rating for the quality of its education data. The following year, California "addressed" this low ranking... by declining to participate in the survey. Then-Governor Jerry Brown, a declared skeptic of the value of education data systems, consistently opposed, blocked, or defunded many efforts to build or improve the quality and availability of education data, preferring to leave the matter to individual school districts.
In July 2021, Governor Newsom signed a bill into law to create a new education data collection system for California. This data system, poetically named P-20W, brings together data from early childhood, K-12, postsecondary, and the workforce (thus the W), all to better inform educators, parents, and students. This legislation builds off the Cradle-to-Career Data Systems Act, which had set out requirements for the creation of a new statewide data collection system. These pieces of legislation are important because they are making data accessible as well as making it easier for students and families to plan the road to college and beyond.
One basic purpose of a state data system for education is to identify meaningful patterns, such as improvement in the educational trajectory of students from one year to the next.
The potential usefulness of education data systems is enormous — not just for analysis at the state level, but for practical use in the operation of schools and districts. Education data systems can enable students, parents, teachers, and school leaders to see assignments, get access to course materials, view grades, collect feedback and improve communication. Attendance systems connected to community services can help support attendance. Data systems can support research, shedding light on the effectiveness of educational materials. Data can help to identify extraordinary schools, teachers, and programs. But only if the systems are set up to collect and connect.
As described in Lesson 6.6, teachers and schools have become increasingly reliant on Learning Management Systems (LMS). These digital systems help teachers and students communicate about assignments, deadlines, and coursework. The most popular LMS, Google Classroom, is a free service, but it has many competitors. During the Covid-19 pandemic, LMS usage grew quickly. It is inconvenient for students and teachers to have to use multiple systems, so there is natural pressure for schools and districts to coordinate their choices.
GreatSchools.org provided a State-by-State Assessment of Educational Data Transparency in 2019 by compiling research and data into one report. California's overall score was 1.7 (out of four) because of the large amounts of unavailable and nonexistent data on student growth and college enrollment, persistence, and remediation.
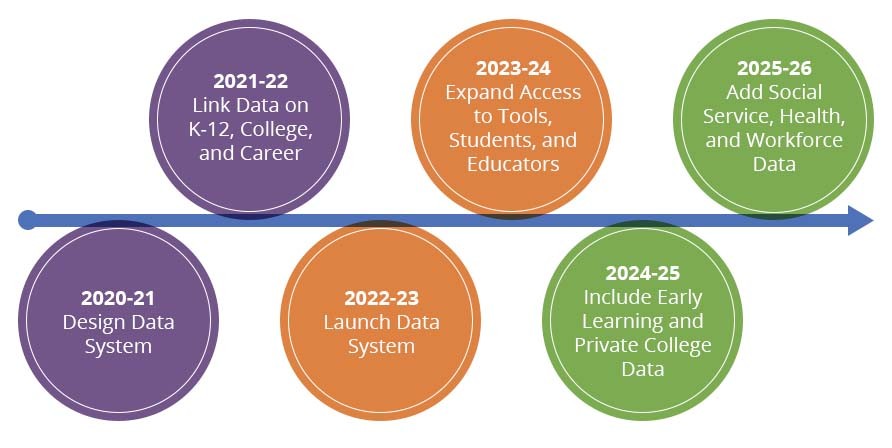 This graphic shows the state's plans to implement its new education data infrastructure by the 2025-26 school year.
When it comes to education data, California is wchanging the game.
The DQC was an early critic of the weaknesses of California's existing data systems for education, but hardly the only one. For example, a 2013 report from the Public Policy Institute of California (PPIC) echoed many of the same themes, as does a 2017 publication from the Education Insight Center titled California's Maze of Student Information.
One of California's major data systems for education is the California Longitudinal Pupil Achievement Data System, commonly known as CALPADS. The core element of CALPADS is a unique identifier for each student that remains consistent even as the student advances through grades and moves from one school to the next. While the CALPADS has been operational since 2009, the data it collects is not easily accessible to districts or to the public. It also does not collect data on pre-kindergarten, higher education, and workplace and social service agencies that contribute to the full story and educational experience of students' success.
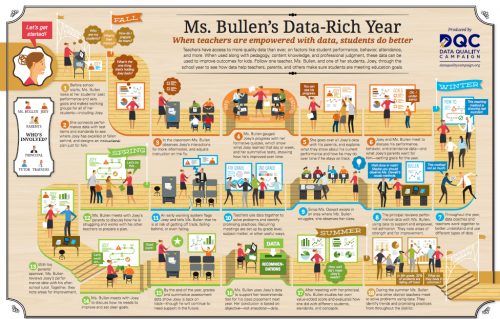 This infographic from the Data Quality Campaign describes some ways data can support teaching and learning. A related infographic emphasizes the value of data for school leaders.)
Districts struggle to make sense of their data
Previous efforts to create linked data systems across sectors have been attempted in California, thanks to local effort. Doing this work, however, requires that local districts assemble (and pay for) their own data systems. These systems don't communicate well. When data moves, it's usually with a lot of trouble and delay. When we need answers for Ed100, it can be worse than finding a needle in a haystack, because it isn't even clear which haystack to look in.

SARCs. School Accountability Report Cards (SARCs) demonstrate the deep limitations of California’s data approach. This report, published by school districts, is meant to satisfy both state and federal requirements for public access to information about each school. Some of the data in the report comes from the State Department of Education. Other information must come from the school district, and some information can only come from the school.
The State provides a sample template for the SARC; school districts have the choice of using it, creating their own, or contracting with an outside vendor. School districts can use whatever approach they wish to make the SARC available to the public, but must also include a link on their web site and submit the SARC to the state Department of Education. The result is a separate PDF file for each school each year. The state does not audit or summarize the data from this field of digital haystacks. Determined researchers can bring their own pitchfork to the job by visiting SARConline, where some schools voluntarily post their reports.
LCAPs. Since 2014, districts and charter schools have been required to create a document known as the Local Control Accountability Plan (LCAP). Each year, each district is expected to use the LCAP to "tell its local story." The LCAP template requires specific kinds of information — but as with the SARC, the end result is a haystack of PDF files, often with multiple versions. The template does not "expose" data digitally, in a way that would make it easy to use. For example, to compare data from one district’s LCAP to another involves hand-copying it into a spreadsheet. Although the data included in LCAPs ought to be consistent with the data in SARCs, there is no mechanism to facilitate or enforce this consistency.
SPSAs.The LCAP, in principle, is meant to align with the information in SARCs as well as with each school's separate School Plan for Student Achievement, yet another document required under state law.
In an effort to be thorough, and to comply with state and federal requirements, these documents go on for pages and pages. They are comprehensive, but frequently incomprehensible.
Mandates
With the right data system, used consistently, all of this accountability reporting could be made more accessible for the public, more straightforward for districts, and more consistent in general. But that kind of data infrastructure does not appear to be part of the America's plan, at least at this writing.
One obstacle to improving the state's data structure is to get everyone to use the same systems, or at least systems that treat data in compatible ways. Another is the complexity of ensuring that the systems effectively protect the privacy of students and teachers. Big businesses and government organizations face these issues all the time — they can be solved with leadership and work. Finding the leadership to sort out California's education data haystacks is a complex problem. For one thing, it's unclear who is in charge. School districts are substantially left to find their own ways of solving data problems. Getting them to do things the same way, or even use the same data definitions, can run afoul of California's laws against creating state mandates.
Data issues may seem wonkish. They rarely fire up the passions of politicians, education activists, or parent leaders. But it seems inconceivable that this data weakness can continue forever in America, especially in California, the home of Silicon Valley.
A new beginning?
Several studies in a 2018 research project known as Getting Down to Facts II (GDTFII) focused on what California needs to do to improve its data standards and data systems so that programs and investments can deliver better results for kids. Among the headline findings is the importance of leadership: "Developing a comprehensive statewide data system requires leadership and commitment."
In 2018 Governor Gavin Newsom campaigned for office pledging change: "Overarching all of this work — from prenatal to college and career — is my promise for California to reassert itself as an education data leader. The public deserves to know whether all students, regardless of background, have access to good schools and equitable funding."
Education advisory committees such as the Governor's Committee on Education Excellence have long recommended that the state establish a data commission to facilitate decisions about standards and points of integration, including data from social services, teacher-related systems, employment systems and higher education. California now has that commission.
Updated March 2018, November 2018, February 2019, December 2021, July 2022
CHAPTER 9:
Success
-
Success
Overview of Chapter 9 -
Measures of Success
For Kids and For Schools -
Student Success
How Well is My Kid Doing? -
Tests
Standardized Measures of Student Learning -
Student Readiness
College and Career -
Education Data
Keeping Track of the School System -
Achievement Gaps
The System's Biggest Challenge -
The Dashboard
Measuring California School Performance -
After High School
What California’s System Provides -
Paying for College
High hopes and college loans
Related
-
Wishful thinking
Grade inflation and cognitive biases -
Progress
Are Schools Improving? -
Accountability in Education
Who monitors the quality of schools? -
School Funding
How Money Reaches the Classroom -
Effectiveness
Is Education Money Well Spent? -
Measures of Success
For Kids and For Schools -
Student Success
How Well is My Kid Doing? -
Student Readiness
College and Career -
Achievement Gaps
The System's Biggest Challenge -
The Dashboard
Measuring California School Performance
Sharing is caring!
Password Reset
Search all lesson and blog content here.
Login with Email
We will send your Login Link to your email
address. Click on the link and you will be
logged into Ed100. No more passwords to
remember!


Questions & Comments
To comment or reply, please sign in .
Jeff Camp - Founder July 16, 2023 at 1:29 pm
The freshest data about course enrollment available from the CDE is now literally an astonishing four years old, which I believe might be a new record.
Jeff Camp - Founder July 7, 2022 at 9:59 pm
francisco molina August 31, 2022 at 6:34 pm
Leigh Boghoussian February 5, 2020 at 11:13 am
This lesson was one of the most discouraging for me to read - representative of short-sighted thinking and the impacts thereof.
Susannah Baxendale March 22, 2019 at 4:01 pm
Jamie Kiffel-Alcheh December 7, 2019 at 3:41 pm
francisco molina March 1, 2019 at 1:48 am
Jeff Camp August 24, 2018 at 11:09 pm
Jeff Camp July 4, 2018 at 12:41 pm
Gloria Lucioni January 6, 2019 at 10:06 pm
Carol Kocivar June 18, 2018 at 6:46 am
It finds that the fragmentation of California’s education data systems makes it nearly impossible for the state to assess how well its students are progressing from high school, to and through college, and into the workforce.
Read the report.
Jeff Camp - Founder April 24, 2018 at 3:15 pm
Iris December 1, 2017 at 7:02 pm
Caryn-C September 15, 2017 at 8:56 am
We are lucky to participate in a district with pretty solid education data systems, at least from this parent's perspective.
I loved the infographic showing "what could be". In an underfunded classroom of 30 plus students, sorry Joey--no way would you get that kind of intervention.
g4joer6 April 22, 2015 at 11:31 pm
"Imagine if Amazon.com were unable to keep track of customer purchases. Imagine a pharmaceutical company unable to tell one pill from another. Or a bank losing track of accounts. In the last few decades, the world has become accustomed to organizations that can keep track of things in large numbers, in great detail.
Education has a long way to go in that regard, especially in California."