


California's Dashboard for College and Career Success

Are Students Ready for What Comes Next?
Each year, about 85% of California's students graduate from high school. But how many are ready for what comes next?
According to the California School Dashboard, the answer is less than half.
The College and Career Ready indicator on the California School Dashboard is meant to show "whether high school students are prepared for likely success after graduation." The state has struggled for years with how to define and measure college and career readiness, and the Dashboard College/Career indicator represents the evolving answer.
To understand this Dashboard indicator, it's necessary to dig into the particulars a bit. California evaluates the success of high schools and districts based on evidence of the "likely success" of students beyond graduation.
Levels of Preparedness
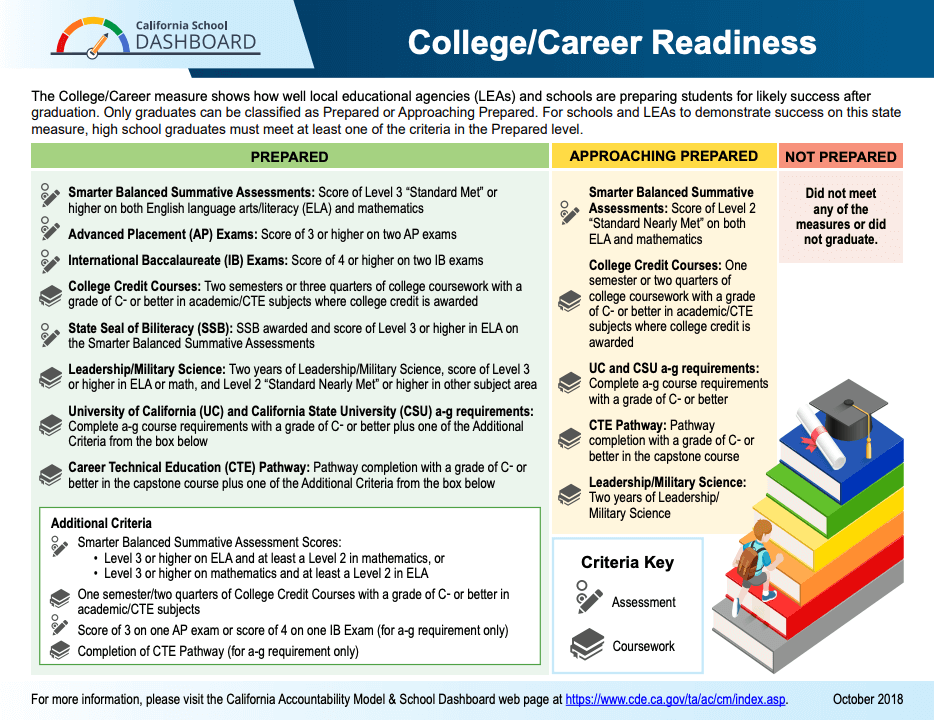
The state categorizes each high school student's likely success in one of three levels: Prepared, Approaching Prepared, or Not Prepared.
The most straightforward way for students to provide evidence of their great expectations is to score well (level 3 or better) on the state's standardized tests for both math and English Language Arts, known to most students and parents as the CAASPP. (The CAASPP tests are also known as "Smarter Balanced" tests, because they have been developed as part of a multi-state consortium under that name.) California automatically uses CAASPP scores in grade 11 as evidence of college/career readiness.
Students have some additional ways to demonstrate their readiness. For example, a student's readiness level can be boosted by scores on other tests like AP and IB exams, by qualification for the state Seal of Biliteracy, and by completing college-level coursework. Students can also complete sets of courses associated with the state's defined career "pathways." The state has identified 58 career technical education pathways in 15 industry sectors, and the State Board of Education signaled that the list of qualifying pathways may expand over time.
As of early 2019, scores on the SAT and ACT are not included in the state's definition of college/career readiness, though the idea has been considered. A high school diploma is a minimum requirement in all cases. There is a fair amount of fine print, literally. (Click or tap the image to view a printable PDF.)
How Many Make the Cut?
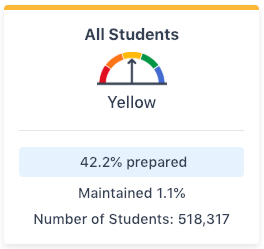
There are about half a million public school students in each "class year" in California (whether they graduate or not). Of the 518,317 students in the class of 2018, the Dashboard reported that 42.2% of them were prepared for College or Career. Another 17.1% were "approaching prepared."
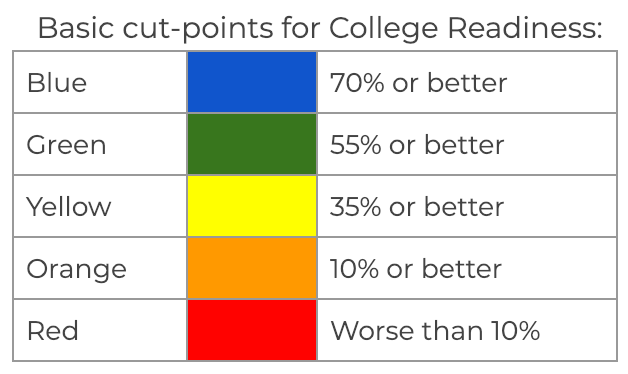
The Dashboard indicator for college and career uses the following cut points to evaluate the performance of schools, districts, or groups. If preparedness rates are stable — that is, not getting significantly better or worse than last year — these are the basic levels:
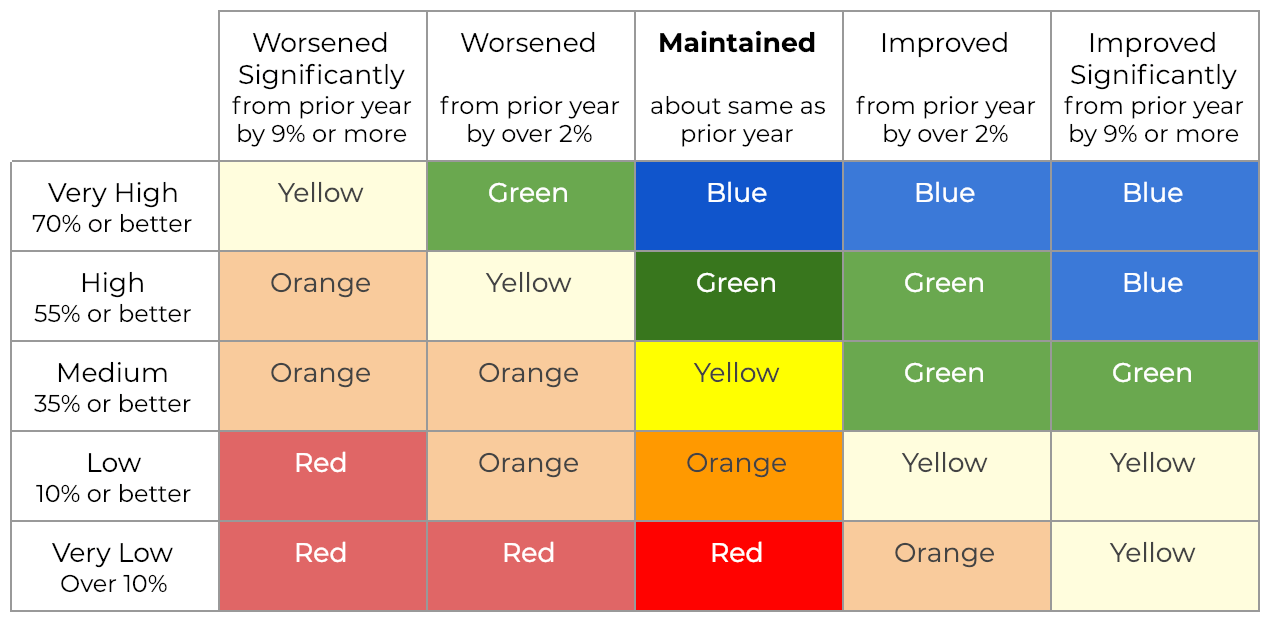
As with all indicators on the dashboard, the performance color is designed to reflect not just these basic cut-points, but the direction and significance of change toward them or away from them. Where college readiness rates are improving more than 2% year-on-year, the dashboard may assign a sunnier performance color. The reverse is also true. In the table below, the middle column ("maintained") matches the cut-points above. The columns to the right reflect an improving trend; those to the left reflect a worsening trend.
Exceptions? Of Course!
The calculated results shown on the Dashboard incorporate quite a few exceptional cases to avoid unintended (and confusing) results. For example, continuation high schools or other high schools with high concentrations of "at risk" students (over 70%) are evaluated using "Dashboard Alternative School Status" (DASS). Success metrics for these schools are defined separately and differently from ordinary schools. You can learn more about DASS in the Ed100 explanation of the California School Dashboard Graduation indicator.
As with the Graduation Rate indicator, when the College and Career indicator is applied to a group of fewer than 150 students, the outer columns of the 5x5 color table are combined with the inner ones. In this "three-by-five methodology" the dashboard simply shows whether results got worse, stayed about the same, or got better. By eliminating the nuance of by how much, this methodology avoids chopping up the data into groups too small to be displayed.
For the down-and-dirty details check the Department of Education's ever-evolving Technical Guide to the Dashboard. (If this link is dead or you know it to be out of date, please notify us. Unfortunately, there's no reliable web address for the most up-to-date version of this technical guide. We last spotted an updated edition deep within this page.)
Using Dashboard data, EdSource has created a search-and-compare tool that makes comparisons easier.
This post is the ninth in a series about the California School Dashboard, the state's main tool for monitoring progress in the improvement of schools. If you don't understand the basics about the Dashboard — especially how it blends "status" and "change" — you might want to read this blog series from the start.
Context: Ed100 Lesson 9.7
Part 1: Overview
Part 2: The Indicators
Part 3: Performance Colors
Part 4: Math and English
Part 5: English Learners
Part 6: Attendance and Absenteeism
Part 7: Suspensions
Part 8: Graduation
Part 9: College and Career Success
Part 10: "Local" Indicators for School Districts
Tags on this post
All Tags
A-G requirements Absences Accountability Accreditation Achievement gap Administrators After school Algebra API Arts Assessment At-risk students Attendance Beacon links Bilingual education Bonds Brain Brown Act Budgets Bullying Burbank Business Career Carol Dweck Categorical funds Certification CHAMP Change Character Education Chart Charter schools Civics Class size CMOs Collective bargaining College Common core Community schools Contest Continuous Improvement Cost of education Counselors Creativity Crossword CSBA CTA Dashboard Data Dialogue District boundaries Districts Diversity Drawing DREAM Act Dyslexia EACH Early childhood Economic growth EdPrezi EdSource EdTech Effort Election English learners Equity ESSA Ethnic studies Ethnic studies Evaluation rubric Expanded Learning Facilities Fake News Federal Federal policy Funding Gifted Graduation rates Grit Health Help Wanted History Home schools Homeless students Homework Hours of opportunity Humanities Independence Day Indignation Infrastructure Initiatives International Jargon Khan Academy Kindergarten LCAP LCFF Leaderboard Leadership Learning Litigation Lobbyists Local control Local funding Local governance Lottery Magnet schools Map Math Media Mental Health Mindfulness Mindset Myth Myths NAEP National comparisons NCLB Nutrition Pandemic Parcel taxes Parent Engagement Parent Leader Guide Parents peanut butter Pedagogy Pensions personalized Philanthropy PISA Planning Policy Politics population Poverty Preschool Prezi Private schools Prize Project-based learning Prop 13 Prop 98 Property taxes PTA Purpose of education puzzle Quality Race Rating Schools Reading Recruiting teachers Reform Research Retaining teachers Rigor School board School choice School Climate School Closures Science Serrano vs Priest Sex Ed Site Map Sleep Social-emotional learning Song Special ed Spending SPSA Standards Strike STRS Student motivation Student voice Success Suicide Summer Superintendent Suspensions Talent Teacher pay Teacher shortage Teachers Technology Technology in education Template Test scores Tests Time in school Time on task Trump Undocumented Unions Universal education Vaccination Values Vaping Video Volunteering Volunteers Vote Vouchers Winners Year in ReviewSharing is caring!
Password Reset
Search all lesson and blog content here.
Login with Email
We will send your Login Link to your email
address. Click on the link and you will be
logged into Ed100. No more passwords to
remember!


Questions & Comments
To comment or reply, please sign in .