


Local Indicators on the California School Dashboard

The Dashboard’s Hidden and Colorless gems
If you’ve seen the California School Dashboard, you know about the color ratings that schools and school districts receive. Those colors, based on information collected from school districts by the state, have received most of the attention in California’s reporting and accountability system.
Less discussed, but perhaps more important for parents, are the Local Indicators, which are developed by school districts but not based on data collected by the state.
Here's what three of the local indicators look like on the Dashboard.
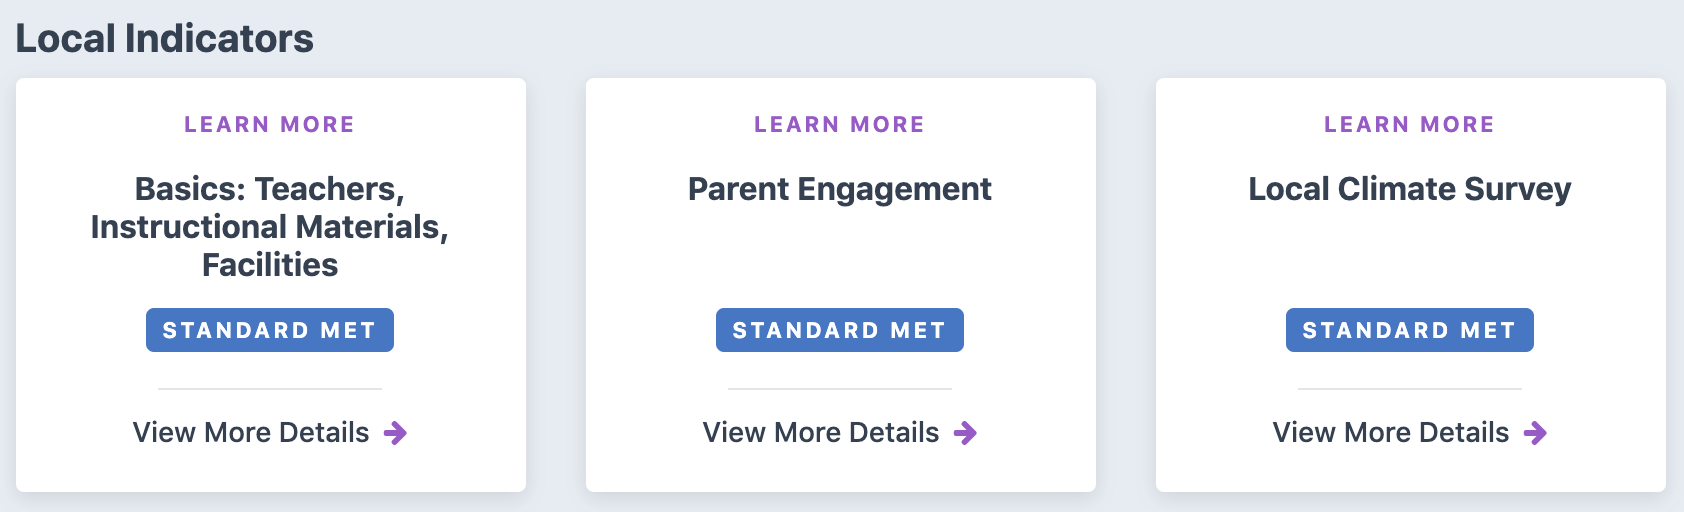
In addition to the three indicators above, there are two more — but you get the idea. The text in the blue bar will say “Standard Met,” probably. (It could also read “Standard Not Met,” or “Standard Not Met for 2 or More Years.”) Not very exciting on the face of it, but underneath that “View More Details” prompt hides information worth digging for.
Why don’t the Local Indicators get color ratings too?
The Local Indicators differ from the colorful State Indicators in several ways. The state can assign colors for the latter because they are based on uniform data that every school district has to collect and submit. All of the State Indicators are:
- calculated according to specific rules so the results are comparable;
- reported for every school and school district; and
- used to report how well different groups of students are doing.
That set of indicators provides information about how well students are doing, such as graduation rates, scores on state tests, and suspension rates.
Rather than focusing on student outcomes, the Local Indicators address inputs: the conditions that support student success. The Local Indicators are also only reported on the Dashboard for the district as a whole, not for individual schools or specific student groups. (There is an exception: charter schools must report the Local Indicators on the Dashboard.)
How are the Local Indicators calculated and scored?
Each school district chooses how it will measure its progress and report on the Local Indicators. The state provides some guidance but largely leaves it to districts to report the way they choose to on the Dashboard. (We’ll provide an example of what that guidance includes below.)
Now, about that “Standard Met” button.
It doesn’t mean the district met a particular level of quality. Rather, it just means that the district provided information about the standard on the Dashboard. That’s why it’s essential to click the “View More Details” link if you want to have any real information about these important school conditions.
Clicking once will lead you only to a brief definition of the indicator. Persevere. One more click on that “View More Information” link, and you’ll see what your district reported in response to prompts provided by the state. Districts have to limit this summary to a few hundred words, but the state recommends they include a link to more information. Presumably, a full description of the measures and results would be available to stakeholders as part of the district’s planning process.
What can the Local Indicators tell you?
There are five Local Indicators, each with multiple prompts. Here’s a summary:
|
The Local Indicators on the California School Dashboard, Summarized |
|
|---|---|
|
Basic conditions |
Teachers, buildings and textbooks |
|
Standards implementation |
Steps taken to make sure teachers understand and can teach new material |
|
School climate & conditions |
How safe and connected students feel at school |
|
Access to a broad course of study |
Equitable opportunities for all students to experience a full and rigorous curriculum |
|
Parent involvement |
What is done to involve parents and how well it’s working |
A Sample of a Local Indicator
To provide a real-world example, let’s look at how one district filled out one Local Indicator. Our example is for “Access to a Broad Course of Study.” This indicator has four prompts. For each, we provide the district’s actual summary response. We then suggest a question or two that the summary inspires. After all, the point of the Dashboard is to inspire dialogue!
|
Prompt 1 |
District Response |
|---|---|
|
The measures or tools the district is using to track students’ access to state-required subject areas. |
“Grades 1-5: All elementary students have access to core subject areas including ELD. The district has an instructional schedule for all grades and programs that includes these subjects. Additionally, principals collect individual teacher schedules and conduct periodic walkthroughs to monitor implementation of approved schedule. Grades 6-12: All students have access to Language Arts, Math, Science, Social Studies, World Languages, PE, and ELD (as appropriate). Art, music, and other elective options are also available for students.” |
Questions: How does the district define “core subject areas”? Does it include the arts, for example? How is “all students have access” measured? [Note: "ELD" is an abbreviation for "English Language Development," which refers to development of English fluency. "Language Arts" is the term for development of communication skills in English.]
|
Prompt 2 |
District Response |
|---|---|
|
A summary of differences in access across school sites and student groups and progress in improving access |
“Grades 1-5: All students have access to Language Arts, Math, Science, Social Studies, Health, PE, and ELD. Art and Music is less consistent and varies from school to school. Science implementation isn’t as strong as we would like because of the difficulty in conducting lab experiences in a multi-subject setting. Five of our elementary schools provide Spanish Two-Way Bilingual Immersion programs. Grades 6-12: All students have access to Language Arts, Math, Science, Social Studies, World Languages, PE, and ELD (as appropriate). Art, music, and other elective options are also available for students.” |
Questions: Which schools and student subgroups are least likely to have access to those “elective options” mentioned? What proportion of students enroll in the various subject areas at your local high school and how does that differ from other schools?
|
Prompt 3 |
District Response |
|---|---|
|
Identification of any barriers preventing access to a broad course of study for all students. |
“Grades 1-12: Funds and the length of the school day are our primary barriers.” |
Question: How would the district spend additional funds and instructional time if they were available?
|
Prompt 4 |
District Response |
|---|---|
Revisions, decisions, or new actions to ensure access to a broad course of study for all students. |
“Grades 1-12: We are currently focusing on improving NGSS implementation by providing PD and piloting quality instructional materials. This will improve the implementation of this course of study.” |
Question: Why is science the only course of study receiving attention right now? [Note: NGSS is an acronym for California's new science standards. PD (Professional Development) means training.]
What is your district reporting?
So here’s your homework. You could do this alone or make it a group activity with other folks at your school, maybe including both parents and teachers.
- Go to the California School Dashboard.
- Look up your school district and pick one or more of the Local Indicators.
- Click through to the information provided and read through it with some care, jotting down questions that arise for you.
- See if the district provided a link to more detailed district information as part of its response.
If you want to go further, look on the CA State PTA website at the Quick Guides to the State Priorities. These guides provide background information about why each priority is important and suggest some questions to ask. The California Department of Education also provides detailed guidance about what districts are supposed to report for each of the Local Indicators.
The California Department of Education provides additional guidance about the Local Indicators in the Technical Guide to the California School Dashboard, which is updated at least annually.
This post is part of Ed100's series about the California School Dashboard:
Context: Ed100 Lesson 9.7
Part 1: Overview
Part 2: The Indicators
Part 3: Performance Colors
Part 4: Math and English
Part 5: English Learners
Part 6: Attendance and Absenteeism
Part 7: Suspensions
Part 8: Graduation
Part 9: College and Career Success
Part 10: "Local" Indicators for School Districts
Tags on this post
Dashboard Parent Engagement School ClimateAll Tags
A-G requirements Absences Accountability Accreditation Achievement gap Administrators After school Algebra API Arts Assessment At-risk students Attendance Beacon links Bilingual education Bonds Brain Brown Act Budgets Bullying Burbank Business Career Carol Dweck Categorical funds Certification CHAMP Change Character Education Chart Charter schools Civics Class size CMOs Collective bargaining College Common core Community schools Contest Continuous Improvement Cost of education Counselors Creativity Crossword CSBA CTA Dashboard Data Dialogue District boundaries Districts Diversity Drawing DREAM Act Dyslexia EACH Early childhood Economic growth EdPrezi EdSource EdTech Effort Election English learners Equity ESSA Ethnic studies Ethnic studies Evaluation rubric Expanded Learning Facilities Fake News Federal Federal policy Funding Gifted Graduation rates Grit Health Help Wanted History Home schools Homeless students Homework Hours of opportunity Humanities Independence Day Indignation Infrastructure Initiatives International Jargon Khan Academy Kindergarten LCAP LCFF Leaderboard Leadership Learning Litigation Lobbyists Local control Local funding Local governance Lottery Magnet schools Map Math Media Mental Health Mindfulness Mindset Myth Myths NAEP National comparisons NCLB Nutrition Pandemic Parcel taxes Parent Engagement Parent Leader Guide Parents peanut butter Pedagogy Pensions personalized Philanthropy PISA Planning Policy Politics population Poverty Preschool Prezi Private schools Prize Project-based learning Prop 13 Prop 98 Property taxes PTA Purpose of education puzzle Quality Race Rating Schools Reading Recruiting teachers Reform Research Retaining teachers Rigor School board School choice School Climate School Closures Science Serrano vs Priest Sex Ed Site Map Sleep Social-emotional learning Song Special ed Spending SPSA Standards Strike STRS Student motivation Student voice Success Suicide Summer Superintendent Suspensions Talent Teacher pay Teacher shortage Teachers Technology Technology in education Template Test scores Tests Time in school Time on task Trump Undocumented Unions Universal education Vaccination Values Vaping Video Volunteering Volunteers Vote Vouchers Winners Year in ReviewSharing is caring!
Password Reset
Search all lesson and blog content here.
Login with Email
We will send your Login Link to your email
address. Click on the link and you will be
logged into Ed100. No more passwords to
remember!


Questions & Comments
To comment or reply, please sign in .