


The 100 Best Public High Schools in California

Wow! But...
Every year lists come out touting the 100 “best” high schools in California. Be wary when you look at them. Any time someone creates a list of the “best,” it’s good to ask a basic question. In this case, that question is “the best at what?”
- The best at getting kids into elite colleges?
- The best at educating kids who are poor?
- The best at educating kids with special needs?
- The best at educating kids whose parents went to college?
- The best at educating affluent students?
Let’s Look at the Top Schools on These Lists
The chart below drills down to look at the “best” schools on two major lists. I call them School A and School B. That’s right. These lists chose very different schools. (The schools go nameless in this blog because these lists should not confer bragging rights.)
Both schools show academic excellence. No quibbling that the kids do very well. But each list uses different selection criteria. This makes a big difference in which schools are picked as “best”.
- List A scores 60 per cent for academics and 10 per cent for diversity.
- List B factors in the percentages of economically disadvantaged students — who tend to score lower — to identify schools performing much better than statistical expectations.
Take a minute to compare these schools. Then, ask yourself: What are these schools “best” at?
|
Student Demographics |
Top School |
Top School |
California |
|---|---|---|---|
|
English Learners |
1.3 % |
0% |
20% |
|
Low Income |
5.6 % |
23.9% |
60% |
|
Special Needs |
4.3 % |
1.5% |
11% |
|
White |
57 % |
4% |
23.2% |
|
Asian |
31% |
59% |
9.2% |
|
Hispanic |
6.9% |
15.3% |
53.3% |
The data above is from the 2017-2018 School Accountability Report Cards for each school.
We Are Number One!
So, what did you see? First off, it’s pretty clear that these number one “best” schools don’t come close to reflecting the diversity of students in California schools. They represent a thin slice of schools with very few English Learners, very few students with special needs, and relatively few students from low-income families.
- The top school in List A appears to be best at educating mostly affluent white and Asian students who are fluent in English and have very few disabilities.
- The top school in List B appears to be best at educating a mixture of income students who are mostly Asian and Hispanic. Like List A, it reflects schools where students are fluent in English and very few have disabilities.
Comparing the Lists
Let's try another approach. Rather than compare schools, let's compare the lists. Below are some high schools in San Francisco. I call them schools C, D, E, F, and G. (Yes, they are real schools. My kids went to one of them.)
Is there a correlation between the lists? Definitely. In both lists, the ranking is strongly connected to the percentage of low-income students in a school. In the aggregate, though, less-wealthy student communities tend to fare better on List B than on List A because that's what the rules of the list were set up to do. Do list A and list B rank give each school the same rank? Not even close.
|
School |
List A Rank |
List B Rank |
% Low Income |
|---|---|---|---|
|
C |
20 |
11 |
37.5 |
|
D |
137 |
87 |
24.2 |
|
E |
229 |
85 |
53.5 |
|
F |
387 |
118 |
68 |
|
G |
359 |
183 |
65.9 |
The income data is from the 2017-2018 School Accountability Report Cards for each school.
What did we learn? First, you have to look carefully at what rankings measure. This goes beyond great test scores, graduation rates and teachers. Who are the kids who attend these schools?
- Are the best schools those that primarily educate wealthy students with no significant learning challenges?
- Are the best schools those that help both affluent and low-income students succeed?
Or are some of the best schools omitted from these lists because the metrics simply don’t pick up their success? For example, what if a school is great at helping kids who have suffered trauma? What if a school is great at helping kids with special needs?
A Better Way to Measure Success?
The research is clear that students from affluent, educated families tend to begin school with a head start. Students from these families tend to learn to read earlier. They learn numbers earlier. They attend preschool and learn the norms of school earlier.
If a school enrolls many students with these advantages, it will tend to score well on tests. It's not so much that the school is great, necessarily, if it serves as an effective filter. Can or should a school or district be considered the “best” if it starts with these advantages and merely it maintains its lead?
Another way to consider greatness in a school is to consider context. When schools score well in exclusive neighborhoods with lots of advantages, well, that's expected. When schools score well in ordinary neighborhoods, that's Hollywood.
Which students progress faster? Rich or Poor?
In 2018 a major study associated with the Getting Down to Facts project compared evidence of student learning in low-wealth districts and affluent districts, with some very interesting findings. Compared to the national average, California’s low income students start school farther behind but improve at a faster rate. Wealthy students, on the other hand, improve at the same rate as other wealthy students.. According to the study:
“California students have a greater rate of improvement in average test scores than the rest of the country, and that growth rate is more equitably distributed. (The only exception is the wealthiest districts, which are on par with the rest of the country.)
These findings indicate that the disparities between California’s low-income districts and the rest of the country are not a result of students in non-affluent districts not learning as much; rather they suggest that children from poor families have fewer educational opportunities in early childhood, leading them to start kindergarten at a deficit.”
A school is not “bad” because its students start out from behind. The corollary: a school is not the “best” just because its students start out ahead.
The California School Dashboard: Another way to measure success
California once ranked schools, as these lists do. But the state has moved away from a single number ranking system to a Dashboard that includes multiple measures. A quick warning for those who want instant winners and easy answers: There is no number one.
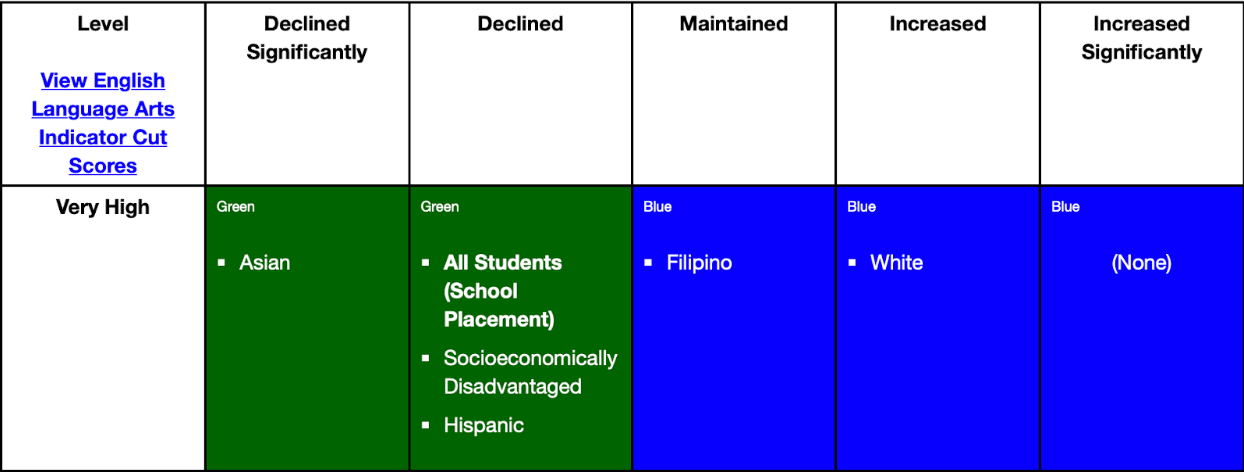
The Dashboard looks at performance over time. You can find out how each group of students is progressing. Below is an example from a high-performing school. It shows how each student group is performing in language arts.
Look at the column on the left. It tells you that school performance is Very High.
(A quick primer on the colors. Blue is “great.” Green means doing really well. But the direction of change matters. If performance declines, the color changes from Blue to Green.)
The image below is a portion of a report called a five-by-five table, which can help you see patterns behind the average results. At this school Asians, low income students, Hispanic students, Filipino students and white students as a whole, earned scores in Language Arts that place them in the "very high" category. But these groups are shown on the dashboard with different performance colors based on the direction of change in their scores. White and Filipino students maintained or increased performance, so the performance color for these groups is Blue. Asian students, low income students and Hispanic students earned scores that, while very high, showed signs of decline.
To learn much more about the California School Dashboard, have a look at Ed100 lesson 9.7 and follow the links to the blog posts.
Which Are the 100 Best Public High Schools?
These rankings of top schools have a certain appeal. They produce a winner and that school is number one. They also imply, intentionally or not, that if a school is not ranked well on their list, the school is not so good.
But we can see just from looking at samples from these two “best “ lists that there really is not a number one or number ten or number twenty school. These lists disagree—sometimes dramatically. And they leave out schools with other measures of success. If there is one takeaway, it is that there are many many ways to look at success.
So what should you do the next time someone talks about how well a school is ranked? First, congratulate the students, teachers and parents. It takes a lot of effort to achieve academic excellence. But then take it a step further. Use it as an opportunity to discuss the many ways of measuring success, what these lists reveal and what they are missing.
Tags on this post
Quality Rating Schools Test scoresAll Tags
A-G requirements Absences Accountability Accreditation Achievement gap Administrators After school Algebra API Arts Assessment At-risk students Attendance Beacon links Bilingual education Bonds Brain Brown Act Budgets Bullying Burbank Business Career Carol Dweck Categorical funds Certification CHAMP Change Character Education Chart Charter schools Civics Class size CMOs Collective bargaining College Common core Community schools Contest Continuous Improvement Cost of education Counselors Creativity Crossword CSBA CTA Dashboard Data Dialogue District boundaries Districts Diversity Drawing DREAM Act Dyslexia EACH Early childhood Economic growth EdPrezi EdSource EdTech Effort Election English learners Equity ESSA Ethnic studies Ethnic studies Evaluation rubric Expanded Learning Facilities Fake News Federal Federal policy Funding Gifted Graduation rates Grit Health Help Wanted History Home schools Homeless students Homework Hours of opportunity Humanities Independence Day Indignation Infrastructure Initiatives International Jargon Khan Academy Kindergarten LCAP LCFF Leaderboard Leadership Learning Litigation Lobbyists Local control Local funding Local governance Lottery Magnet schools Map Math Media Mental Health Mindfulness Mindset Myth Myths NAEP National comparisons NCLB Nutrition Pandemic Parcel taxes Parent Engagement Parent Leader Guide Parents peanut butter Pedagogy Pensions personalized Philanthropy PISA Planning Policy Politics population Poverty Preschool Prezi Private schools Prize Project-based learning Prop 13 Prop 98 Property taxes PTA Purpose of education puzzle Quality Race Rating Schools Reading Recruiting teachers Reform Research Retaining teachers Rigor School board School choice School Climate School Closures Science Serrano vs Priest Sex Ed Site Map Sleep Social-emotional learning Song Special ed Spending SPSA Standards Strike STRS Student motivation Student voice Success Suicide Summer Superintendent Suspensions Talent Teacher pay Teacher shortage Teachers Technology Technology in education Template Test scores Tests Time in school Time on task Trump Undocumented Unions Universal education Vaccination Values Vaping Video Volunteering Volunteers Vote Vouchers Winners Year in ReviewSharing is caring!
Password Reset
Search all lesson and blog content here.
Login with Email
We will send your Login Link to your email
address. Click on the link and you will be
logged into Ed100. No more passwords to
remember!


Questions & Comments
To comment or reply, please sign in .
Leslie1 September 28, 2019 at 11:24 am
Jeff Camp May 8, 2019 at 7:40 pm
Bruce Ross1 April 29, 2019 at 9:22 am